- Home
-
BUY WITH US
-
SELL WITH US
-
Properties
- Neighborhoods
- Developments
- Testimonials
- Contact Us
- My Search Portal
- Blog
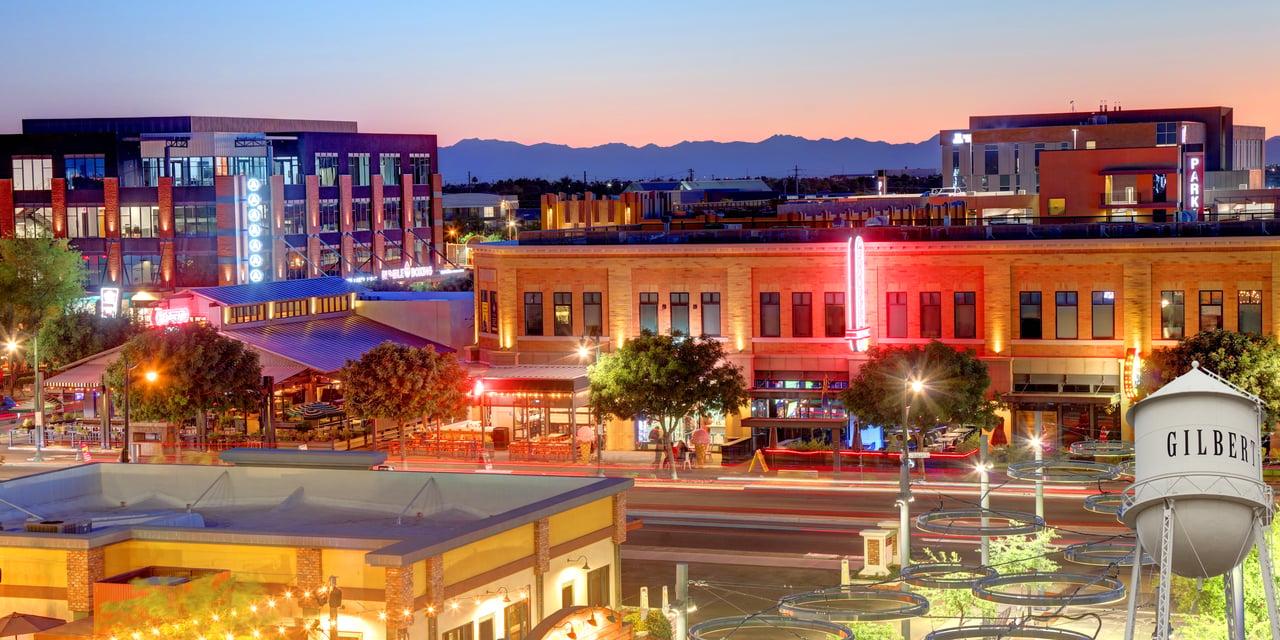
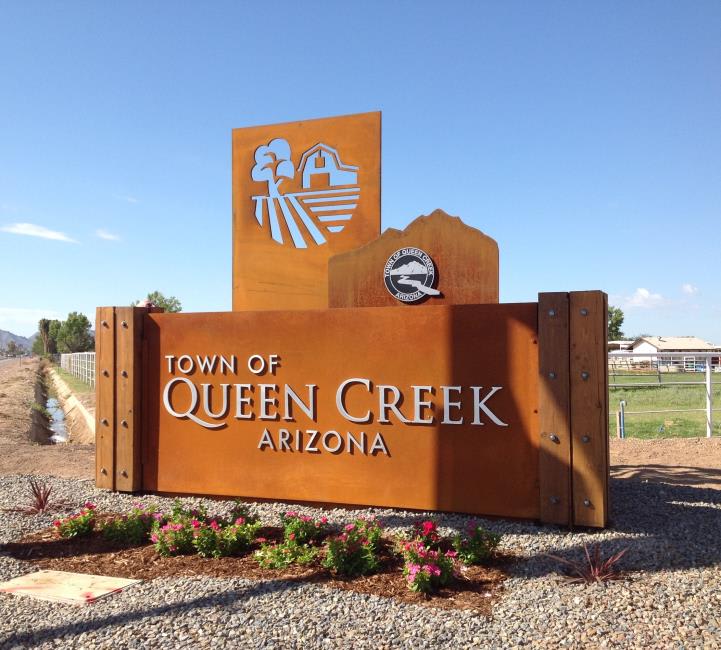
Queen Creek is one of the best-kept secrets in Arizona.
Queen Creek, Arizona is one of the best places to live. With an exceptional climate boasting 330 days of sunshine annually, residents can enjoy outdoor activities year-round. The town is surrounded by natural recreational riches, including the breathtaking San Tan Mountain Regional Park, perfect for hiking, biking, and horseback riding. Queen Creek also offers a relaxed, family-friendly atmosphere while still providing modern amenities like top-rated schools, shopping centers, and dining options. Best of all, you get more bang for your buck—homes here are more affordable and come with larger lots compared to nearby cities like Gilbert and Chandler. If you're looking for the perfect blend of affordability, space, and outdoor adventure, Queen Creek is an unbeatable place to call home.
66,369 people live in Queen Creek, where the median age is 37.2 and the average individual income is $50,866. Data provided by the U.S. Census Bureau.
Total Population
Median Age
Population Density Population Density This is the number of people per square mile in a neighborhood.
Average individual Income
There's plenty to do around Queen Creek, including shopping, dining, nightlife, parks, and more. Data provided by Walk Score and Yelp.
Explore popular things to do in the area, including The Burger Trolley, Paragon Escape Games, and Water Guppies Infant Aquatic Specialist.
| Name | Category | Distance | Reviews |
Ratings by
Yelp
|
|---|---|---|---|---|
| Dining | 3.24 miles | 10 reviews | 5/5 stars | |
| Active | 3.03 miles | 39 reviews | 5/5 stars | |
| Active | 4.78 miles | 12 reviews | 5/5 stars | |
| Beauty | 1.47 miles | 6 reviews | 5/5 stars | |
| Beauty | 1.05 miles | 13 reviews | 5/5 stars | |
|
|
||||
|
|
||||
|
|
||||
|
|
||||
|
|
||||
|
|
Queen Creek has 20,677 households, with an average household size of 3.2. Data provided by the U.S. Census Bureau. Here’s what the people living in Queen Creek do for work — and how long it takes them to get there. Data provided by the U.S. Census Bureau. 66,369 people call Queen Creek home. The population density is 1,627 and the largest age group is Data provided by the U.S. Census Bureau.
Total Population
Population Density Population Density This is the number of people per square mile in a neighborhood.
Median Age
Men vs Women
Population by Age Group
0-9 Years
10-17 Years
18-24 Years
25-64 Years
65-74 Years
75+ Years
Education Level
Total Households
Average Household Size
Average individual Income
Households with Children
With Children:
Without Children:
Marital Status
Blue vs White Collar Workers
Blue Collar:
White Collar:
The Guerrero Group invites you to experience a truly personalized approach to buying and selling—tailored to your goals, guided by expertise, and delivered with distinction.
LET'S CONNECT